FIGURE 5.

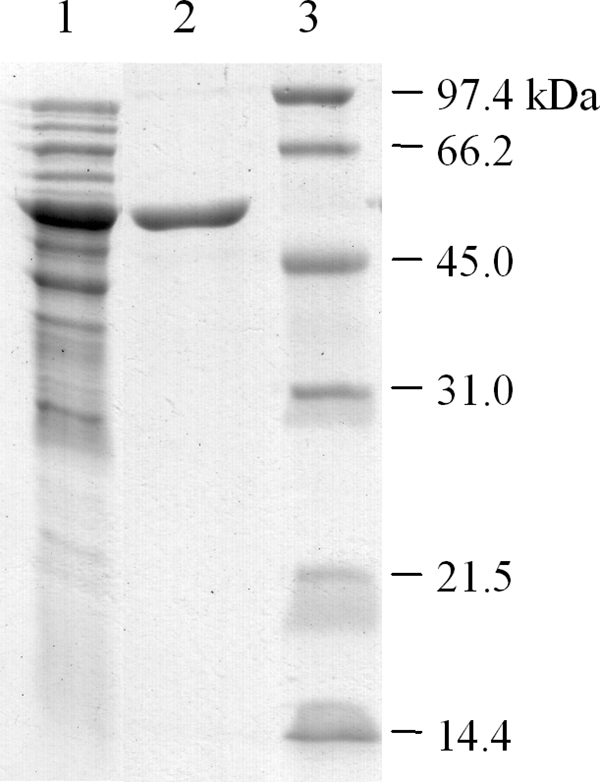
Electropherogram of SauS at different stages of purification. Lane 1, SauS after anion exchange chromatography; lane 2, SauS after cation exchange chromatography; lane 3, molecular mass markers.

Electropherogram of SauS at different stages of purification. Lane 1, SauS after anion exchange chromatography; lane 2, SauS after cation exchange chromatography; lane 3, molecular mass markers.