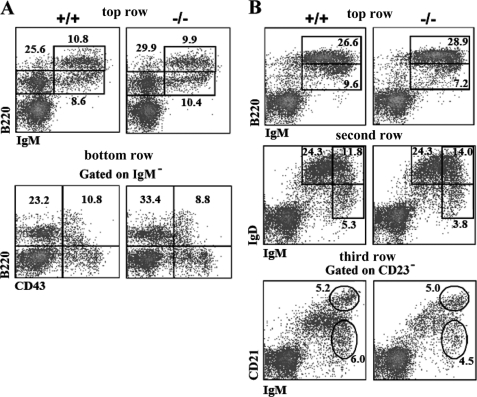
FIGURE 2.
Flow cytometric analysis of lymphoid cell development of Rad9+/+ and Rad9−/− mice. Cells isolated from the bone marrow (A) and spleen (B) of 6–8-week-old mice were stained with the antibodies indicated in each figure. Numbers show relative percentages of cells within indicated gates. These analyses are averages of three pairs of Rad9+/+ and Rad9−/− mice. A, in the bone marrow (BM), top row, staining for pro/pre-B (IgM−B220+), immature (IgM+B220lo), and mature recirculating (IgM+B220hi) B cells; bottom row, staining for pro-B cells (IgM−B220+CD43+) and pre-B cells (IgM−B220+CD43−). B, in the spleen, top row, staining for immature (IgM+B220lo) and mature (IgM+B220hi) B cells; second row, staining for follicular B cells (IgMloIgDhi), transitional type-2 B cells (IgMhiIgDhi), and marginal zone/transitional type-1 B cells (IgMhiIgDlo); third row, staining for transitional type-1 B cells (CD23−IgMhiCD21lo) and marginal zone B cells (CD23−IgMhiCD21hi).

