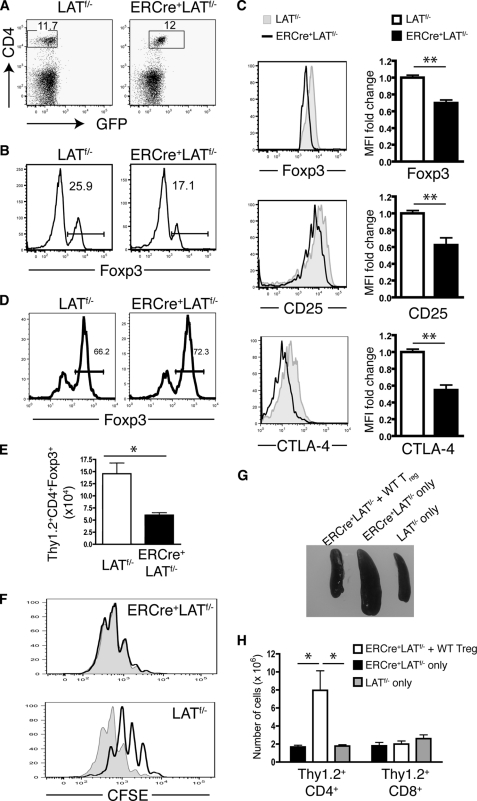
FIGURE 4.
LAT deficiency leads to loss of number and function of Treg cells and reduced expression of Foxp3. A-C, ERCre+LATf/− and LATf/− littermates were treated with tamoxifen on 2 consecutive days. Ten days after the initial treatment, splenocytes were harvested and analyzed by FACS. Data shown are representative of three independent experiments using two mice per genotype in each experiment. A, the CD4 versus GFP profile of splenocytes. The numbers on the FACS plots represent the percentages of the gated populations. B, the percentages of Foxp3+ cells in CD4+ T cells. C, comparison of expression levels of Foxp3 (top), CD25 (middle), and CTLA-4 (bottom) in CD4+GFP−Foxp3+ cells from LATf/− mice and CD4+GFP+Foxp3+ cells from ERCre+LATf/− mice. Bar graphs in the right column represent fold-change in mean fluorescence intensity (MFI) in ERCre+LATf/− compared with LATf/− controls. Data shown are representative of three independent experiments using two mice per genotype for each experiment. D and E, LAT−/− mice were reconstituted with Thy1.1+ wild type CD4+CD25− T cells mixed with Thy1.2+ CD4+CD25+ T cells from either ERCre+LATf/− mice or LATf/− mice followed by tamoxifen treatment. Mice were analyzed 10 days after initial treatment. D, the percentages of Foxp3+ cells in Thy1.2+CD4+ splenocytes. E, the number of Thy1.2+CD4+Foxp3+ cells in spleens. Two-tailed Student's t test; * represents p < 0.05. F, in vitro suppression assay using a 1:1 ratio of responder cells to Treg cells from either ERCre+LATf/− or LATf/− mice. Proliferation of the responder cells is shown by CFSE dilution (the shaded region represents responder cells cultured without Treg cells). The figure shown is one representative of three experiments performed. G and H, LAT−/− mice were reconstituted with ERCre+LATf/− CD4+ T cells mixed with wild type CD4+CD25+ T cells followed by 4 weeks of tamoxifen treatment. Mice reconstituted with only ERCre+LATf/− or LATf/− CD4+ T cells were used as controls. G, spleens from one representative of three mice of each genotype analyzed. H, the total number of Thy1.2+CD4+ and Thy1.2+CD8+ splenocytes in above mice.

