FIGURE 5.
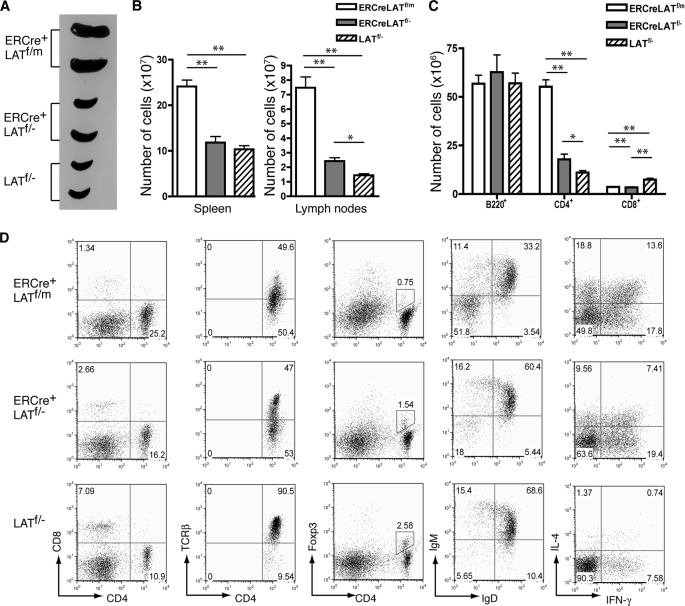
Comparison of the autoimmune syndromes in ERCre+LATf/m and ERCre+LATf/− mice. ERCre+LATf/m, ERCre+LATf/−, and LATf/− mice were treated with tamoxifen for 5 weeks before analysis. A, spleens from two mice of each genotype. B, total numbers of cells in spleens and lymph nodes (n = 4). Two-tailed t test; *, p ≤ 0.01; **, p ≤ 0.001. C, total numbers of B220+, CD4+, and CD8+ splenocytes (n = 4). Two-tailed t test; *, p ≤ 0.01; **, p ≤ 0.001. D, FACS analysis of splenocytes. From left to right: CD8 versus CD4 expression on total cells; TCRβ expression on CD4+ cells; Foxp3 versus CD4 expression on total cells; IgM versus IgD expression on B220+ cells; IL-4 versus IFNγ expression in CD4+ T cells after a 4-h P + I stimulation. The numbers on the FACS plots represent the percentages of the gated populations. FACS plots shown are representative of four mice per genotype.

