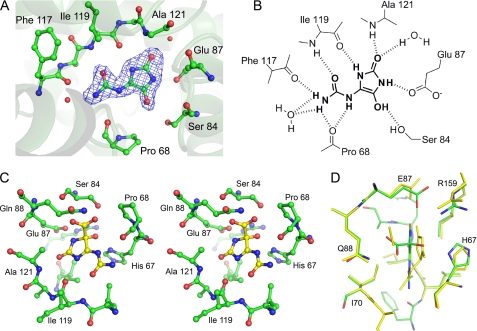
FIGURE 2.
Active site of KpOHCU decarboxylase and ligand contacts. A, shown is the active site with bound product, allantoin, showing Fo − Fc electron density contoured at 3σ. The difference density was calculated before adding the ligand to the model. B, a schematic of ligand binding in KpOHCU decarboxylase active site shows hydrogen bonding between the enzyme and the ligand. C, shown is a stereoview of KpOHCU decarboxylase active site with modeled OHCU (yellow). D, superposition of the energy minimized active site with bound substrate, OHCU (green carbon atoms, red oxygen atoms, blue nitrogen atoms), and the energy minimized active site with bound products, (S)-allantoin and CO2 (yellow) is shown.

