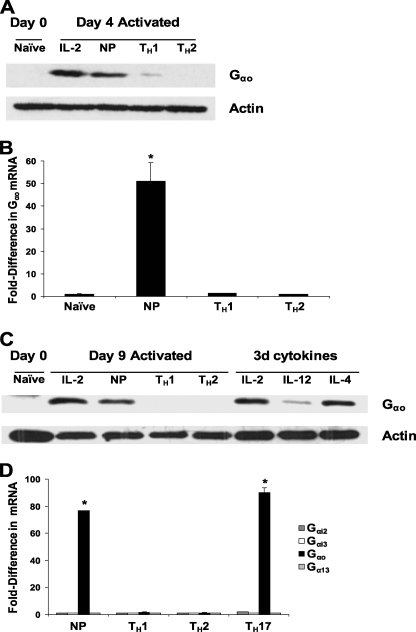
FIGURE 4.
Gαo mRNA and protein are expressed in CD4+ T cells activated in vitro under NP or TH17-polarizing conditions. Naive CD4+ T cells were isolated from cord blood by negative selection and then activated for 6 days with anti-CD3 and anti-CD28 in the presence of rIL-2 alone (IL-2); rIL-2, rTGF-β and antibodies against IL-12, IFNγ, and IL-4 (NP); rIL-2 with rIL-12 and anti-IL-4 (TH1); or rIL-2 with rIL-4 and anti-IL-12 and anti-IFNγ (TH2) as described under “Experimental Procedures.” A, whole-cell lysates (100 μg of protein) from each condition harvested after 4 days of activation were analyzed by Western blotting with anti-Gαo and anti-actin antibodies. The data shown are from one donor and are representative of three donors. B, in separate experiments, cells were activated for 6 days, as described in A, after which each cell type was analyzed by semiquantitative real-time RT-PCR for the expression of mRNAs for Gαo and, as a control, for GAPDH, as described in the legend for Fig. 1. The data shown are the mean -fold differences ± S.E. in expression for Gαo mRNA for assays performed in duplicate for one donor and are representative of three donors. *, p < 0.05 when compared with mRNA abundance in the naive subset. C, naive CD4+ T cells were isolated from cord blood by negative selection and activated for 6 days as described in A. Subsequently, cells were cultured for an additional 3 days under NP or polarizing conditions as indicated. In addition, on day 6, cells that had been activated under NP conditions were left untreated (IL-2) or were treated with rIL-12 (IL-12) or rIL-4 (IL-4) until day 9. Whole-cell lysates (100 μg of protein) from each condition were analyzed by Western blotting with anti-Gαo and anti-actin antibodies. Results are from one donor and are representative of three donors. D, naive CD4+ T cells from cord blood were activated for 6 days with anti-CD3 and anti-CD28 under NP, TH1-, TH2-, or TH17-polarizing conditions as described under “Experimental Procedures.” -Fold differences among the samples in the expression of Gαi2, Gαi3, Gαo, and Gα13 mRNAs, normalized to GAPDH mRNA, were calculated as described in the legend for Fig. 1. For each mRNA of interest, the lowest level of expression versus GAPDH from a single well was set at 1. Values cannot be compared between mRNA species. The data shown are the mean -fold differences ± S.E. in the abundance of the indicated mRNAs assayed in duplicate for one donor and are representative of two donors. *, p < 0.05 when compared with Gαo mRNA abundance in TH2-polarized cells, which showed the lowest Gαo expression.

