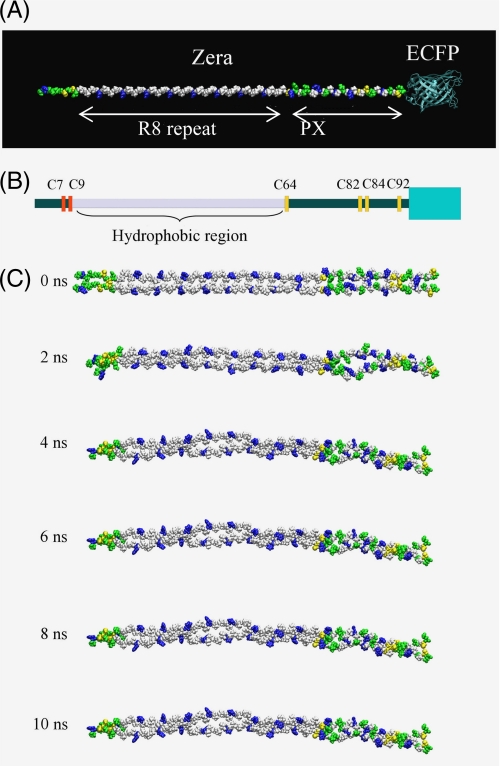
FIGURE 6.
Molecular dynamics calculations. A, initial disposition of Zera molecule in PPII conformation, indicating the R8 and PX regions. ECFP was also shown. B, schematic representation of a Zera monomer, taking into account the disposition of cysteine residues and the relative size of Zera and ECFP (green box). C, snapshots taken from the 10-ns MD simulation of the Zera dimer model. Hydrophobic residues are shown in white, polar residues in green, positively charged residues in blue, and cysteine residues in yellow.

