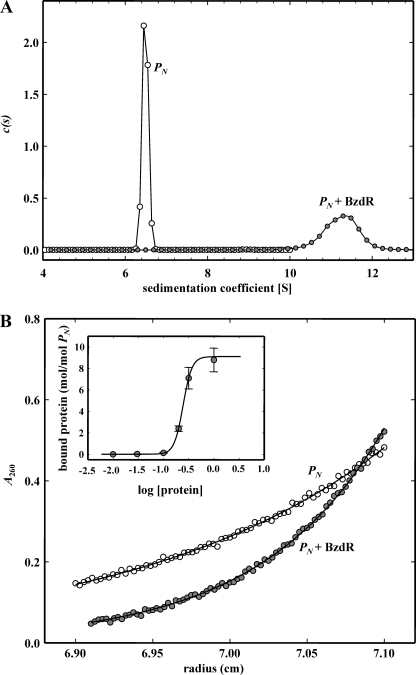
FIGURE 5.
Analysis of complex formation in the interaction of protein His6-BzdR with DNA 253-bp-PN. A, sedimentation coefficient distribution c(s) corresponding to the sedimentation velocity of purified DNA (open circles) and protein-DNA complex (closed circles) at a protein/DNA molar ratio of 10:1. B, corresponding sedimentation equilibrium gradients. Inset represents the variation of bound protein (mol/mol DNA) with protein concentration.

