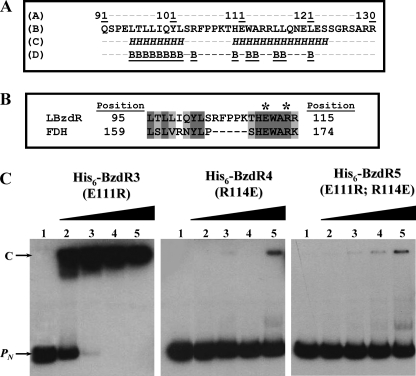
FIGURE 8.
Analysis of the linker region of BzdR. A, amino acid sequence analysis of LBzdR. The position of the LBzdR residues in the primary structure of BzdR is indicated. The sequence of the linker was analyzed using the JPred3 program that predicts residues involved in α-helices, indicated as italic H, and those that have a probability lower than 25% of being located at the protein surface, indicated as underlined B. B, alignment of a region of LBzdR (residues 95–115) with a significantly similar region (residues 159–174) of the formate dehydrogenase from Pseudomonas sp. 101. The dark gray and light gray shadows represent identical residues and conservative substitutions, respectively. The position of the Glu and Arg residues involved in a saline bridge in formate dehydrogenase and the equivalent residues in LBzdR are indicated with an asterisk. C, in vitro analysis of the interaction of BzdR mutants with the PN promoter. Gel retardation analysis of His6-BzdR3, His6-BzdR4, and His6-BzdR5 mutant regulators binding to the PN promoter was performed as indicated in “Experimental Procedures.” Lane 1, free PN probe; lanes 2–5, retardation assays containing 25, 50, 100, or 200 nm, respectively, of purified protein (indicated on the top). The PN probe (PN) and the PN-protein complex (C) are indicated by arrows.

