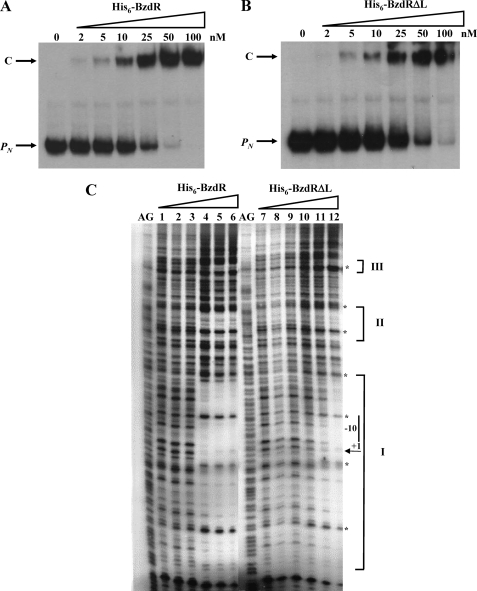
FIGURE 9.
In vitro binding of His6-BzdR and His6-BzdRΔL to the PN probe. A and B, gel retardation analyses of PN were performed as indicated under “Experimental Procedures.” The concentration of purified His6-BzdR (A) and His6-BzdRΔL (B) used is indicated on the top. The free DNA probes (PN) and the protein-DNA complexes (C) are indicated by arrows. C, DNase I footprinting analyses of the interaction of purified His6-BzdR and His6-BzdRΔL with the PN promoter region. The DNase I footprinting experiments were carried out using the PN probe labeled as indicated under “Experimental Procedures.” Lanes 1 and 7 show footprinting assays in the absence of His6-BzdR or His6-BzdRΔL. Lanes 2–6 show footprinting assays containing 5, 25, 200, 400, and 800 nm purified His6-BzdR, respectively. Lanes 8–12 show footprinting assays containing 5, 25, 200, 400, and 800 nm purified His6-BzdRΔL, respectively. Lanes AG show the A + G Maxam and Gilbert sequencing reaction. Protected regions (I, II, and III) are marked by brackets, and the phosphodiester bonds hypersensitive to DNaseI cleavage are indicated by asterisks. The −10 box and the transcription initiation site (+1) of the PN promoter are also shown.

