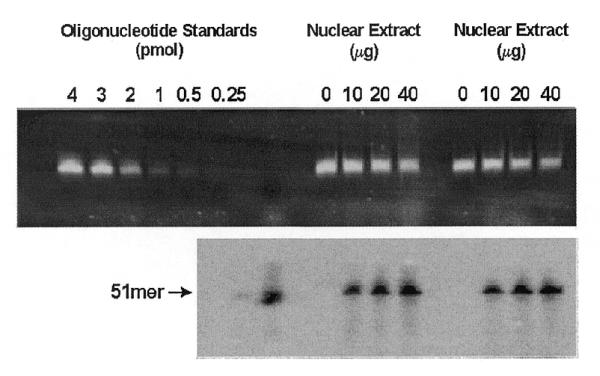
Figure 1.

Fluorescent (top) and autoradiographic visualization (bottom) of recovered oligonucleotide from the UDG initiated-in vitro BER assay. Oligonucleotide standards were loaded spanning the linear range of fluorescent quantification for generation of a standard curve and as a 51 bp size standard (top). A 5′-radiolabeled 51 bp size standard was loaded for autoradiographic visualization.
