FIGURE 9.
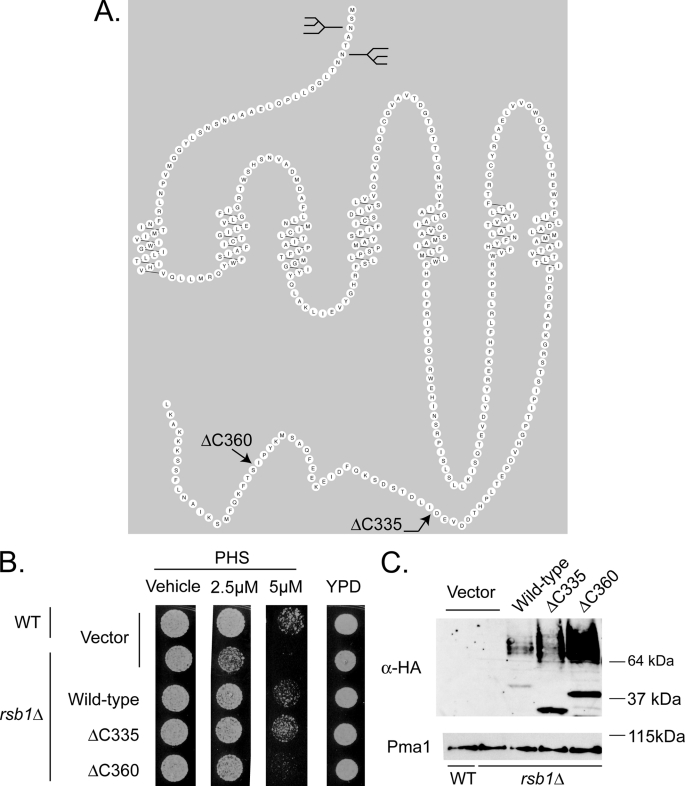
C-terminal truncations of Rsb1 show differential expression and PHS tolerance. A, predicted topology of Rsb1. A prediction for the organization of Rsb1 made by the program RbDe is shown. The locations of previously determined N-linked glycosylation sites in the luminal N terminus (9) are graphically represented by the diagrams. The positions of the C-terminal truncation mutations are indicated by arrows. B, low copy plasmids containing the above forms of Rsb1, along with an empty vector control, were transformed into wild-type and rsb1Δ strains. These transformants were grown to mid-log phase in selective minimal media and spotted onto YPD plates containing varying concentrations of PHS as described above. C, these same cultures from A were extracted using the TWIRL method (as described under “Experimental Procedures”), and equal amounts of total protein were run on SDS-PAGE, transferred to nitrocellulose, and probed using an anti-HA epitope antibody. These membranes were stripped and re-probed for Pma1.

