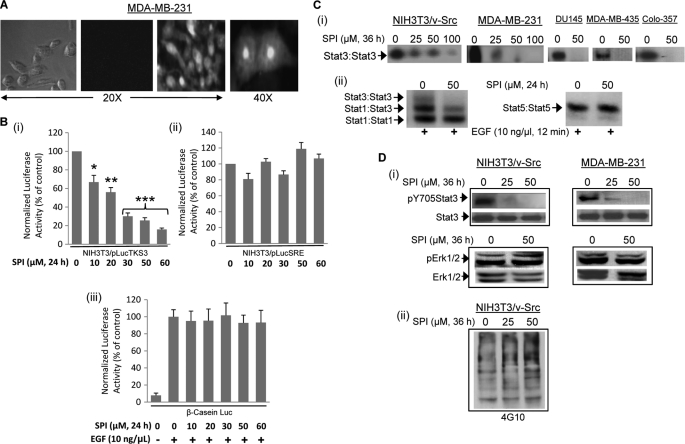
FIGURE 4.
Intracellular uptake and effect of SPI on Stat3 activation. A, phase-contrast and fluorescence imaging of MDA-MB-231 cells following treatment with 30 μm fluorescently labeled (right two panels) or unlabeled (left two panels) SPI for 3 h; Image was captured using Zeiss Axiovert 200 microscope; B, cytosolic extracts of equal total protein were prepared from 24-h SPI-treated or untreated (i) NIH3T3/v-Src/pLucTKS3 fibroblasts that stably express the Stat3-dependent luciferase reporter (pLucTKS3), (ii) NIH3T3/v-Src/pLucSRE that stably express the Stat3-independent luciferase reporter (pLucSRE), or (iii) NIH3T3/hEGFR transiently transfected with β-casein promoter-driven luciferase report (β-casein-Luc) and stimulated with EGF and analyzed for luciferase activity using a luminometer; (C) nuclear extracts of equal total protein were prepared from (i) the designated malignant cells or (ii) EGF-stimulated NIH3T3/hEGFR treated for 24 h with or without SPI and subjected to in vitro DNA binding assay using the radiolabeled hSIE probe (i) and (ii, left panel) that binds Stat1 and Stat3 or MGFe probe (ii, right panel) that binds Stat1 and Stat5 and analyzed by EMSA; and (D) SDS-PAGE and Western blotting analysis of whole cell lysates of equal total protein prepared from SPI-treated or untreated NIH3T3/v-Src and MDA-MB-231 cells and probing for (i) pY705Stat3, Stat3, pErk1/2, and Erk1/2, or (ii) general pY profile. Positions of STATs:DNA complexes or proteins in gel are labeled; control lanes (0) represent cytosolic or nuclear extracts, or whole cell lysates prepared from 0.05% DMSO-treated cells. Data are representative of 3–4 independent determinations or mean and S.D. of 3 independent determinations. *, p < 0.05; **, p < 0.01, and ***, p < 0.005.

