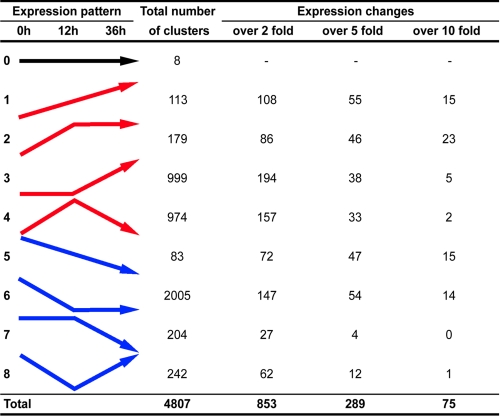
FIGURE 3.
General expression patterns. EST clusters were classified on the basis of their putative expression pattern, deduced from the changes in EST numbers for each cluster during desiccation. Nine expression patterns were defined for genes expressed constantly (pattern 0), up-regulated (patterns 1, 2, 3, and 4), or down-regulated (patterns 5, 6, 7, and 8). Further ranking of each expression pattern was established, based on the greatest amplitude of EST number variation, as compared with the value at 0 h (indicated by over 2 fold, over 5 fold, and over 10 fold).

