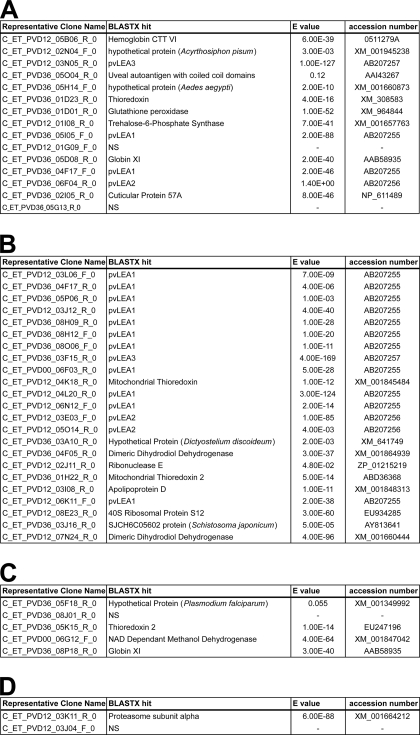
TABLE 1.
Clusters most strongly up-regulated (over 10-fold) during desiccation
All clusters are identified by the name of their representative clone. For each cluster, the closest informative BLASTX hit is given with the corresponding E-value and accession number from NCBI (search performed on June 2008). A, clusters continuously up-regulated throughout desiccation treatment (cf. Fig. 3, pattern 1). B, clusters up-regulated during the first 12 h of desiccation (cf. Fig. 3, pattern 2). C, clusters up-regulated between 12 and 36 h of desiccation (cf. Fig. 3, pattern 3). D, clusters up-regulated during the first 12 h of treatment and then down-regulated (cf. Fig. 3, pattern 4).

