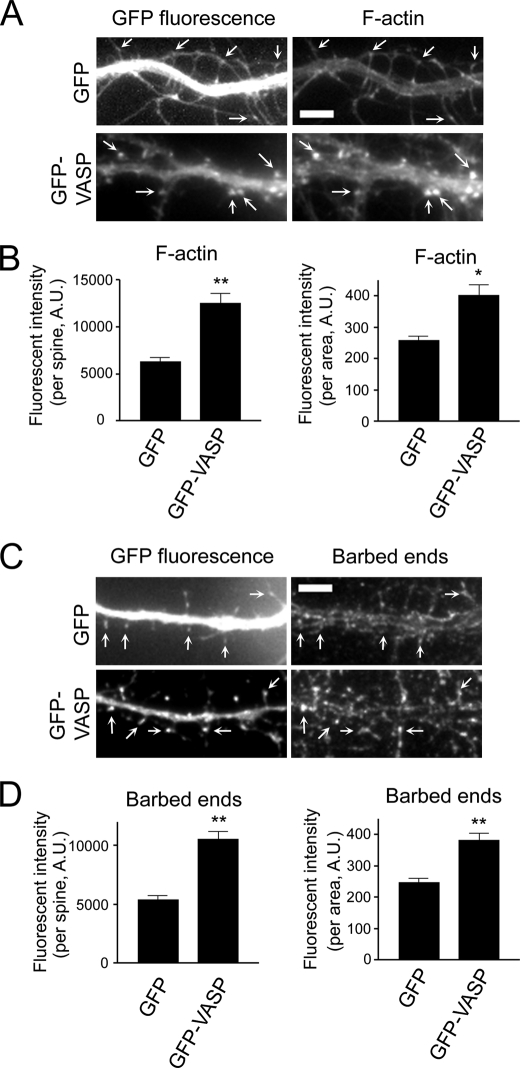
FIGURE 4.
VASP promotes actin polymerization in spines. A, images of GFP and GFP-VASP-expressing neurons stained for F-actin are shown. Arrows indicate dendritic spines. Bar, 5 μm. B, quantification of the fluorescent intensity of F-actin staining in individual spines from GFP and GFP-VASP-expressing neurons is shown (left panel). The fluorescent intensity was normalized to the spine area (right panel). C, images of GFP and GFP-VASP-expressing neurons stained for free actin barbed ends are shown. Arrows indicate spines. Bar, 5 μm. D, quantification of the fluorescent intensity in individual spines from barbed end staining is shown (left panel). The fluorescent intensity was normalized to spine area (right panel). For panels B and D, error bars represent S.E. for 100 spines from three independent experiments (**, p < 0.0001; *, p < 0.01).

