Figure 1.—
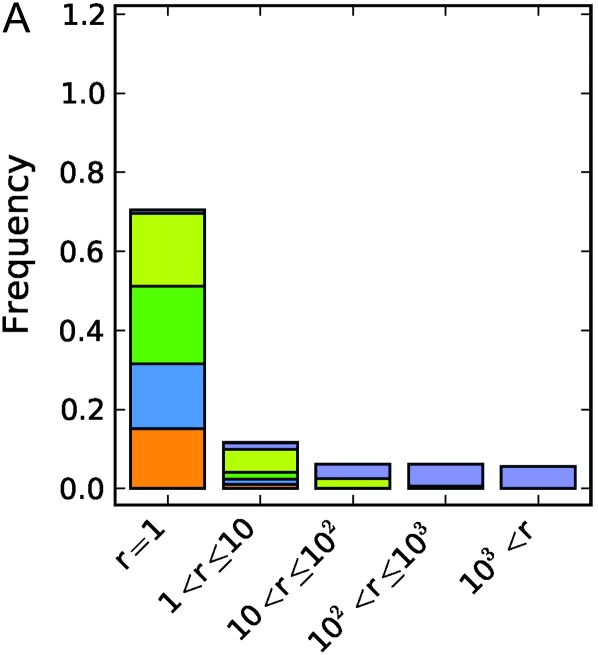
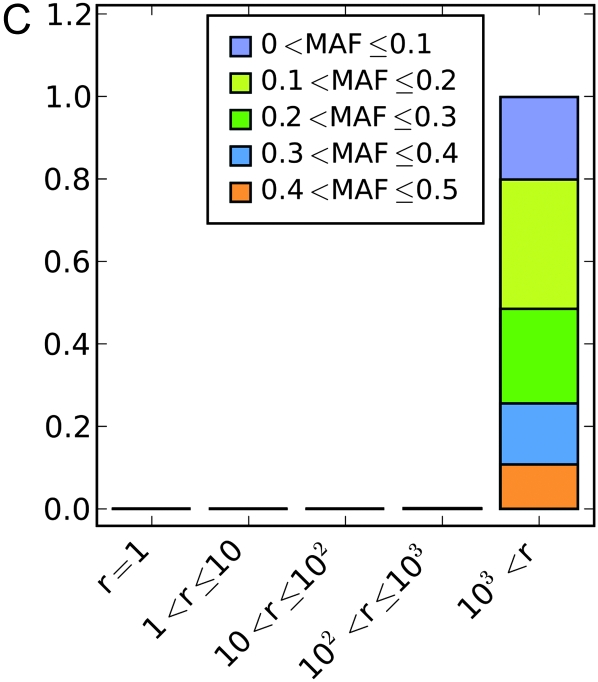
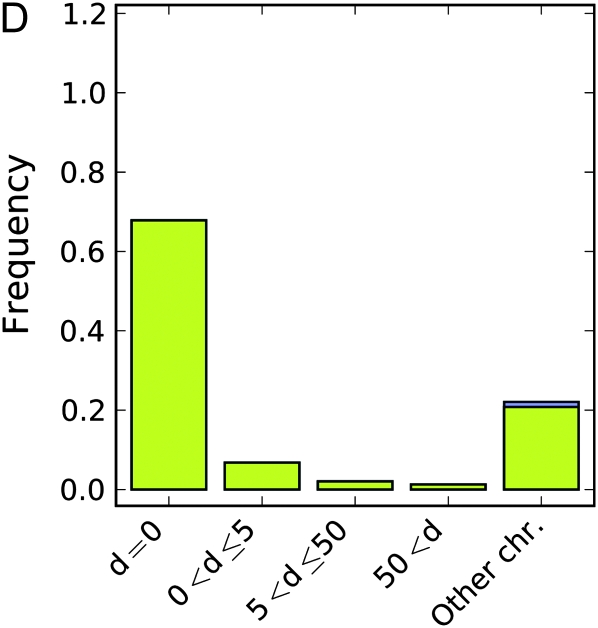
Simulation results for a geographical latent variable, a North–South split. (A–C) Rank of the causative SNP: illustration of how many markers had a stronger association than the causative SNP in a given analysis under (A) the “additive” genetic model, (B) the “or” model, and (C) the “xor” model. Colors indicate the minor allele frequency of the causative SNP. (D–F) Maximum distance to the causative SNP of all SNPs with greater or equal association than the causative SNP under (D) the additive genetic model, (E) the or model, and (F) the “xor” model. Colors indicate whether the causative marker was found to be significant at the Bonferroni threshold. Only results where at least one SNP was found significant were included in the analysis.


