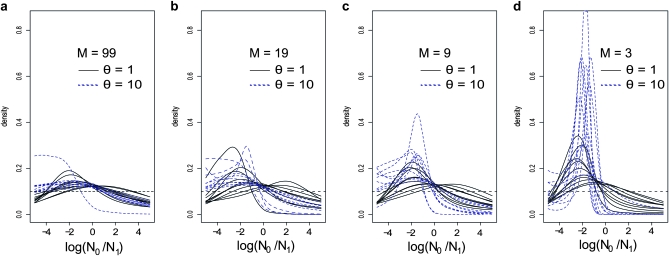
Figure 1.—
Influence of gene flow and genetic diversity in the detection of bottlenecks—posteriors. Posterior distributions were obtained for log10(r), where r is the ratio of present (N0) over ancient (N1) population size change. Negative and positive values of log10(r) correspond to population bottlenecks and expansions, respectively. For all analyses the prior for log10(r) was a uniform between −5 and 5 and is represented by the horizontal dashed line. The results were obtained with five loci and 50 diploid individuals sampled from a single deme assuming a 100-island model (see text for details). (a) Posteriors obtained for all the simulations performed for M = 99 (i.e., FST = 0.01) and for θ = 1 (solid lines) and θ = 10 (dashed lines). (b) Same as in a, but for M = 19 (i.e., FST = 0.05). (c) Same as in a, but for M = 9 (i.e., FST = 0.10). (d) Same as in a, but for M = 3 (i.e., FST = 0.25). Most posterior distributions are shifted to the left but are in general relatively flat for high levels of gene flow and not very different from the prior. Posteriors indicating a potential bottleneck were obtained for the lowest levels of gene flow and the highest genetic.

