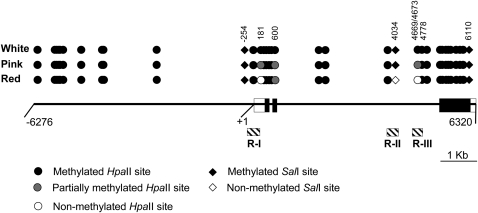
Figure 3.—
Methylation map of the HpaII and SalI sites in white cob, pink cob, and wild-type genotypes based on DNA gel-blot analysis. Solid line represents a single P1-wr copy. Boxes embedded in the solid line represent three exons; open boxes indicate UTRs. Coordinates are below the solid line; “+1” indicates the transcription start site. Hatched boxes indicate the position of three regions (R-I, R-II, and R-III) selected for bisulfite sequence analysis. Methylation status of HpaII (circles) and SalI (diamonds) sites in white cob (p1-ww:DP6) and leaky (p1-ww:DP3) mutants and their wild-type progenitor (P1-wr:LH51) is shown. Coordinates of selected sites mentioned in the text are indicated; two adjacent sites at positions 4669 and 4673 are shown as one circle.

