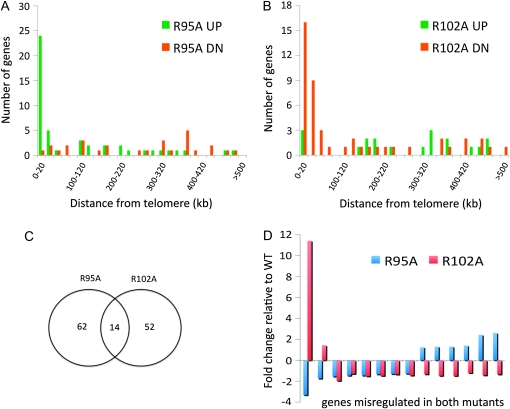
Figure 4.—
Transcription profile of R95A and R102A mutants. (A) Enrichment of genes that are differentially regulated at telomere regions in R95A mutant relative to wild type. (B) Same as A but in R102A mutant. (C) Venn diagram indicating the degree of overlap between gene expression in R95A or R102A mutant strains relative to wild type. (D) Fold change of transcription relative to wild type of genes misregulated in both R95A and R102A mutant strains. The genes were ordered by relative transcript abundance in R95A mutant.

