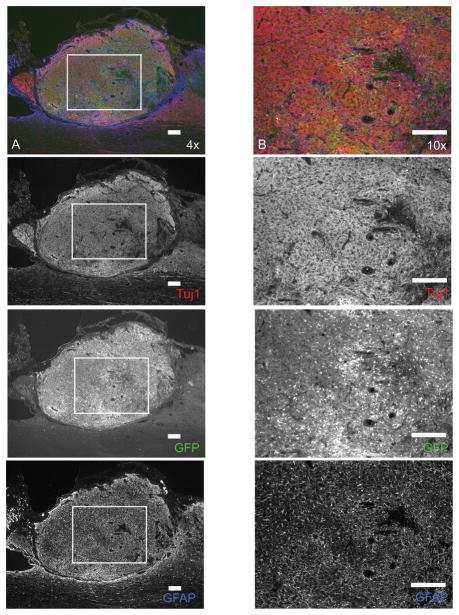
Figure 1.
Image of transplanted ESNPCs after 4 weeks stained with β-tubulin III (Tuj1) for neurons in red, GFP for transplanted ESNPCs in green, and GFAP for astrocytes in blue. The image shows the congested nature of ESNPC transplants that makes it difficult to analyze using stereology. The top image in column A and B is an overlain image of ESNPCs transplanted in the lesion site after 4 weeks stained with Tuj1 for neurons (red), GFP for ESNPCs (green), and GFAP for astrocytes (blue) (scale bar 200μm). The images in column A are 4× images of transplanted ESNPCs found in the lesion of a treated animal. The images in column B are 10× images of the boxed areas in the adjacent image from column A and highlight the congested nature of the transplants (scale bar 200 μm). Each subsequent image from the top of column A and B shows the individual staining of Tuj1 (neurons), GFP (ESNPCs), and GFAP (astrocytes).

