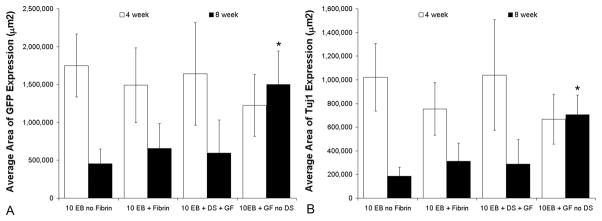
Figure 5.
Average area of GFP and β-tubulin III (Tuj1) expression correlates with the stereological counts of GFP positive ESNPCs and NeuN ESNPCs. A) Average area of GFP expression. No significant difference in the average area of GFP expressing ESNPCs was found between experimental groups after 4 weeks. After 8 weeks, the average area of GFP expression was significantly greater when the ESNPCs were transplanted in fibrin scaffolds containing NT-3 and PDGF-AA with no HBDS (10EB + GF no DS, n = 8) when compared to ESNPCs transplanted alone and in fibrin scaffolds (10EB no Fibrin, n = 7 and 10EB + Fibrin, n = 7) (Error bars represent SEM, * indicates p < 0.05 vs. 10EB no Fibrin and 10EB + Fibrin at same time point). B) Average area of GFP and β-tubulin III co-expression. No significant difference in the average area of GFP and β-tubulin III co-expression was found between experimental groups after 4 weeks. After 8 weeks, the average area of GFP and Tuj1 co-expression was significantly greater when ESNPCs were transplanted in fibrin scaffolds containing NT-3, and PDGF-AA with no HBDS (10EB + GF no DS, n = 8) when compared to the 10EB no Fibrin. (Error bars represent SEM, * indicates p < 0.05 vs 10EB no Fibrin, n = 7 at same time point)

