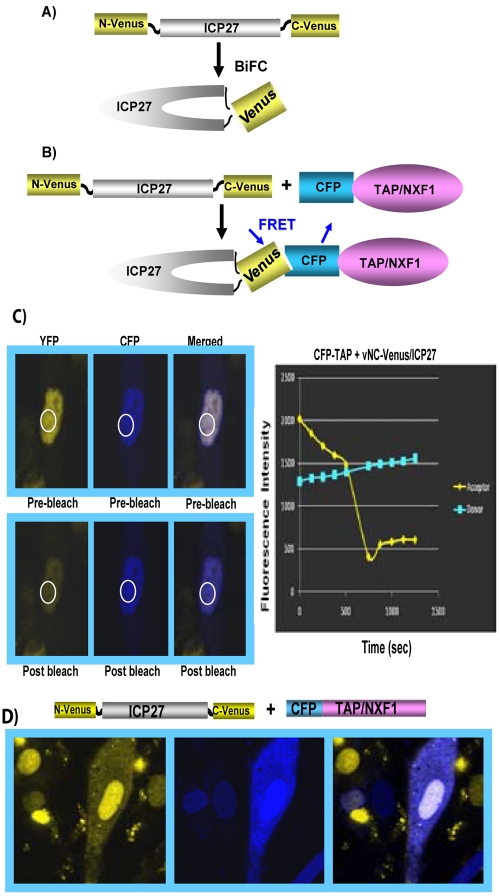
FIG 7 .
BiFC-FRET after photobleaching demonstrates the interaction of TAP/NXF1 with ICP27 upon head-to-tail association. (A) Schematic representation of BiFC for NC-Venus-ICP27. (B) Model showing FRET between CFP-TAP/NXF1 and NC-Venus-ICP27. (C) RSF were transfected with CFP-TAP/NXF1 and were subsequently infected with vNC-Venus-ICP27 at an MOI of 10. Merged images depicting the colocalization of ICP27 with TAP/NXF1 are shown, with the regions of interest circled before and after bleaching of the acceptor. Quantification of FRET for the circled regions is displayed graphically as fluorescence intensity over time. FRET analysis was performed as described in the legend to Fig. 6. (D) RSF were transfected with CFP-TAP/NXF1 and were subsequently infected with vNC-Venus-ICP27 for 6 h. Venus and CFP fluorescence were viewed directly using an LSM confocal microscope at a magnification of ×63.

