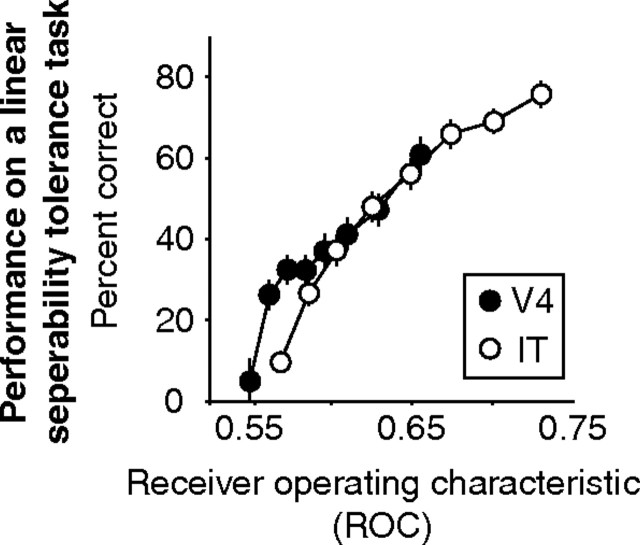
Figure 11.
The relationship between single-neuron ROC and population tolerance. Single-neuron ROC computed as the ROC for discriminations between all six transformations of the best object of a neuron (defined by the highest firing rate after averaging across all transformations) and all six transformations of the nine other objects. Neurons were ranked by their ROC values, and population performance for the linear separability test of tolerance (see Fig. 8b) was assessed for subpopulations of 48 neurons with neighboring ROC values in V4 (black) and IT (white). The x-axis shows the geometric mean ROC of each subpopulation. The y-axis shows population performance for the linear separability test of tolerance (see Fig. 8b).

