
Figure 5.
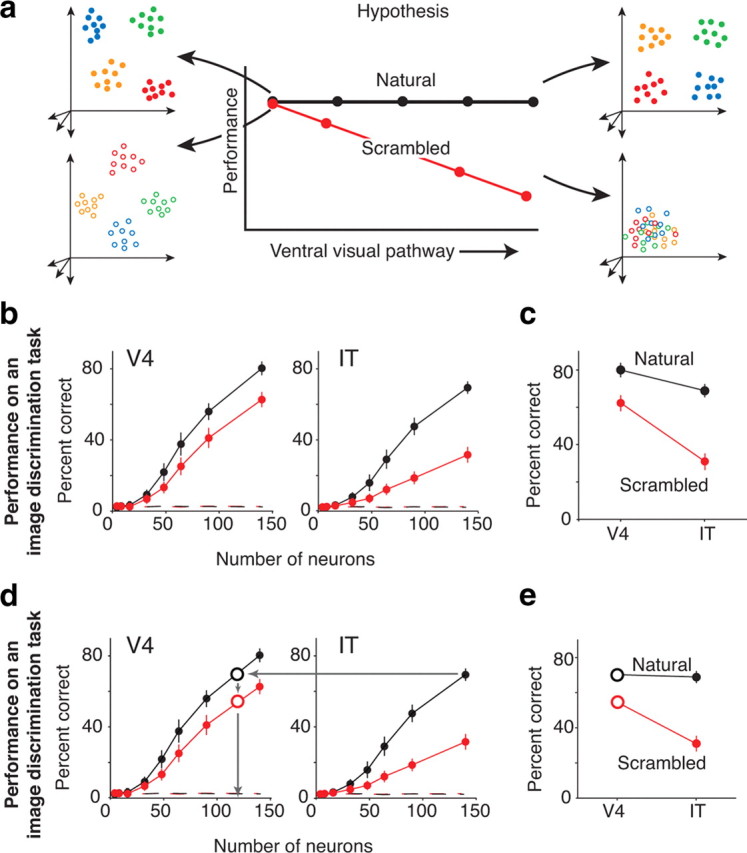
Testing conjunction sensitivity. a, Logic behind the experiment designed to measure conjunction sensitivity. Top left, Response clouds (see Fig. 3) corresponding to the population response to four natural images for an idealized population that encodes local structure within the images. Bottom left, Response clouds for the same population in response to four scrambled versions of the same natural images. In this scenario, scrambling the images activates the population differently, resulting in a repositioning of the response clouds, but the clouds remain a similar distance apart. Top right, Response clouds for an idealized population that encodes specific conjunctions of local structure. Bottom right, Response clouds for the same population in response to scrambled images. In this scenario, destroying the natural feature conjunctions results in the response clouds collapsing toward the origin. b, Performance as a function of the number of neurons for the V4 and IT populations on the discrimination task for the natural (black) and scrambled (red) image sets. Both sets contained 50 images. SE bars indicate the variability (determined by bootstrap) that can be attributed to the specific subset of trials determined for training and testing and the specific subset of neurons chosen. Also shown is chance performance, calculated by scrambling the image labels (dashed lines, ∼2%; see Materials and Methods). c, Performance of the V4 and IT populations for n = 140 neurons. d, In contrast to equating the number of neurons in each population, V4 and IT can be equated via performance on the natural image set; this amounts to limiting the V4 population to 121 neurons compared with 140 neurons in IT. e, Performance of the V4 and IT populations for n = 121 and n = 140 V4 and IT neurons, respectively.