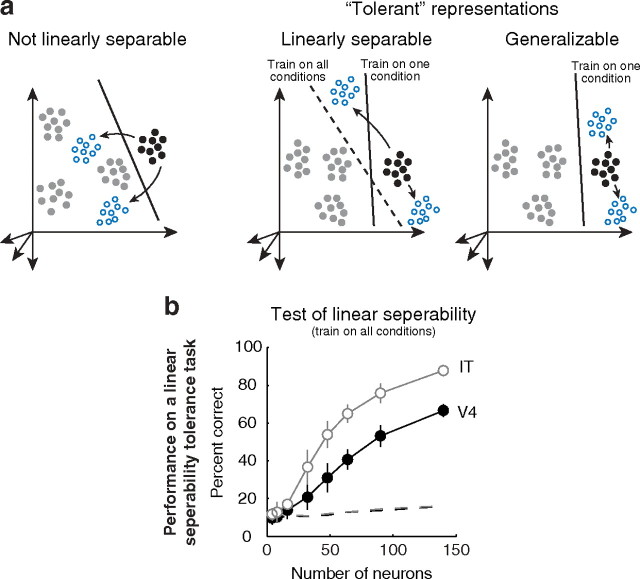
Figure 8.
A second tolerance test: linear separability. a, Hypothetical representations that perform poorly and well at tests of tolerance. Left, A population representation that will fail to support tolerant object recognition because of a lack of linear separability. Middle, A population representation that can, in principle, support tolerant object recognition, but one for which the generalization test presented in Figure 7 may fail to find it. The linear boundary located by training on the reference condition alone (solid line) fails to separate the response vectors corresponding to different transformations of one object from the response vectors corresponding to the other objects. In this case, a more appropriate linear boundary (dashed line) can be located by training on all transformations simultaneously. Right, A population representation that performs well at tests of tolerance when training on the reference condition alone. b, Performance on an object identification task for the six transformations of each of 10 objects when the linear boundaries were trained on response data from all six transformations simultaneously and tested with cross-validation data in IT (white) and V4 (black). Dashed lines indicate performance when different objects at different transformations are randomly assigned to one another (e.g., object 1 at the reference position and scale paired with object 3 shifted left 1.5° and object 6 at 0.5× scale, etc.).

