
Figure 2.
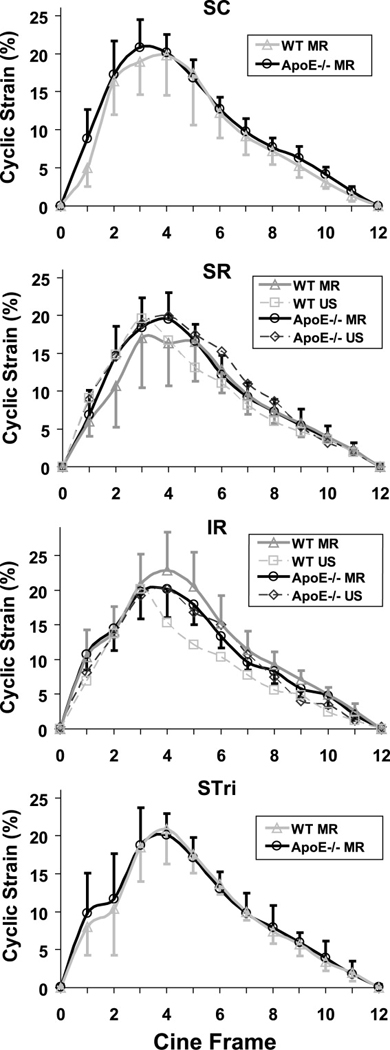
Green-Lagrange circumferential cyclic strain waveforms as a percentage of the diastolic diameter throughout the cardiac cycle at four axial locations (SC, SR, IR, and STri). WT and apoE−/− mice were measured with MR (solid lines) at all four locations, while ultrasound (dashed lines) was used to measure aortic motion at SR and IR levels. There was no significant difference in average maximum strain between genotypes or aortic locations (p > 0.55). MR data shown as mean ± SD. US data shown only as mean for figure clarity (the SD from the US measurements were bounded within SD of MR data).