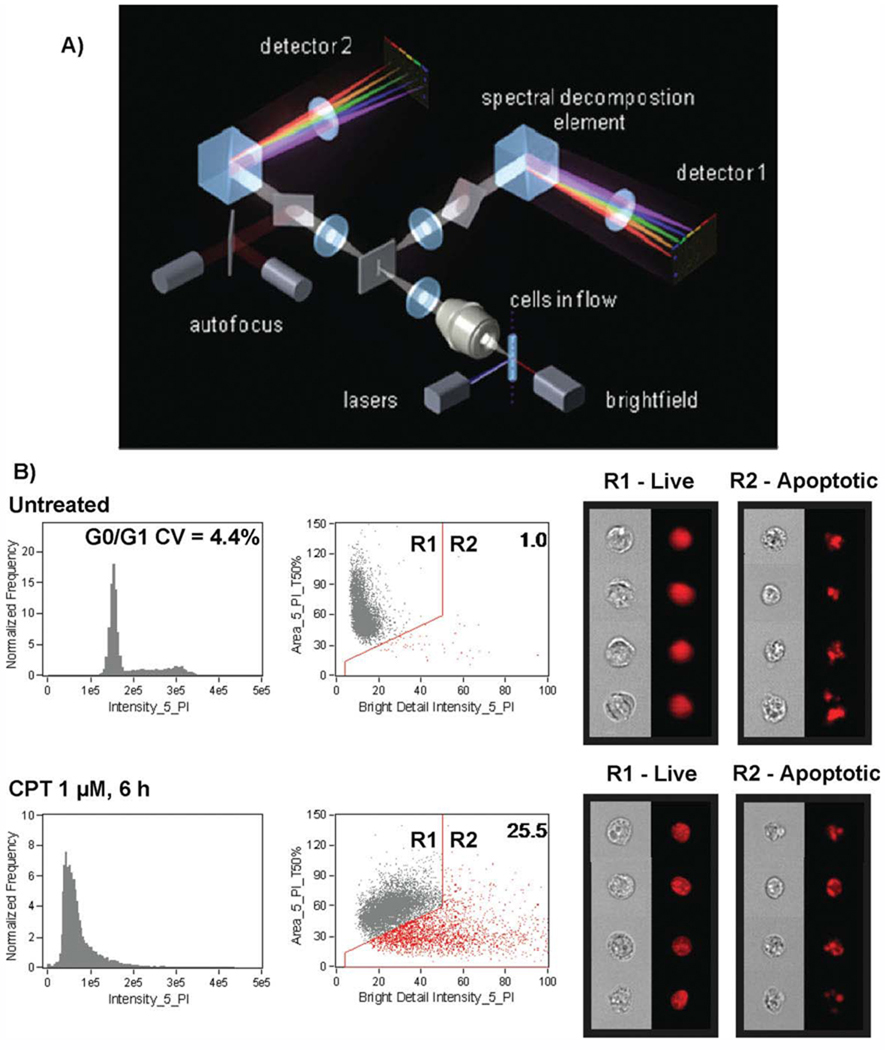
Figure 2.
Multispectral imaging flow cytometer. (A) Layout and key components of the ImageStream high speed imaging system. Cells are hydrodynamically focused into a core stream and orthogonally illuminated with lasers for side scatter (SSC) and fluorescence imaging, and transilluminated for brightfield imaging. Light is collected from the cells with an imaging objective lens (20×, 40×, or 60×) and projected onto a charge-coupled detector (CCD). Before projection on the CCD, the light is passed through a spectral decomposition optical system that directs light of different wavelengths to different lateral positions across the detector, enabling simultaneous capture of up to six spectrally distinct images per detector. In the example shown, cells are illuminated by spatially separated lasers resulting in the generation of two composite images per cell. Each image is spectrally decomposed and projected onto separate detectors, enabling collection of up to 12 images per cell. (B) Morphology-based identification of apoptotic cells using Image Stream. Jurkat cells in midexponential growth were left untreated (top) or were incubated with 1 µM CPT for 6 hours, fixed and stained with PI, then collected on the ImageStream. DNA content histograms of single cells are shown in the left panels. Cells exhibiting nuclear fragmentation (low nuclear area and bright detail intensity) are gated in the histograms at right, with the percentage of apoptotic cells indicated in the upper right corner of the plot. Representative brightfield and PI image of nonapoptotic cells from the untreated sample and apoptotic cells from the treated sample are shown at right (data courtesy of Dr. Tad George and Dr. Brian Hall, Amnis Corporation, Seattle, WA) (31,40). [Color figure can be viewed in the online issue, which is available at www.interscience.wiley.com]

