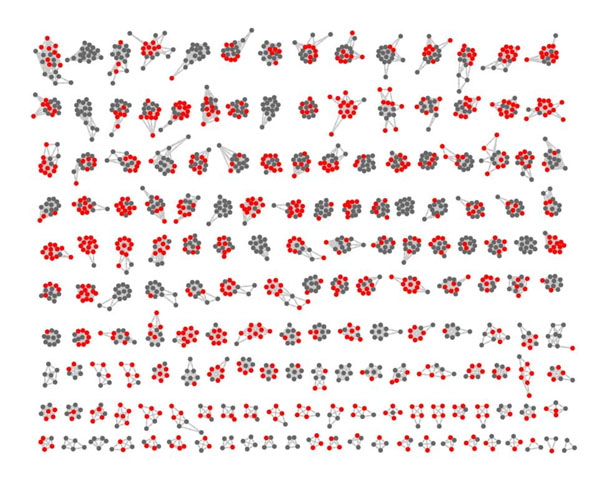
Figure 6.
A section of predicted complexes by algorithm CP-DR with OS(Pc, Kc) ≥0.2. All of proteins and interactions are included in Fig.5. The red vertices represent overlapping proteins among these 172 protein complexes and the gray vertices represent non-overlapping proteins.

