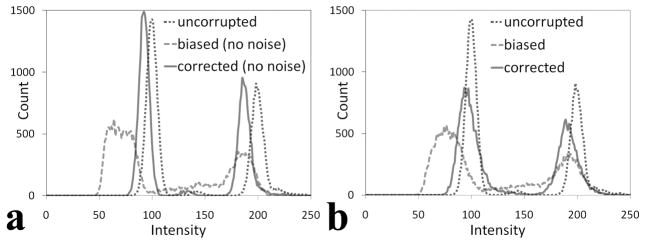
Figure 4.
Intensity distribution of the phantom image. (a) Distribution of the noiseless image with biased field, its corrected image and the uncorrupted image. (b) Histogram of the biased image with additional noise (variance = 100) (Figure 3a), its inhomogeneity corrected (Figure 3b) and the uncorrupted images. After inhomogeneity correction, the histograms of both corrupted images appear closer to the histogram of the uncorrupted image.

