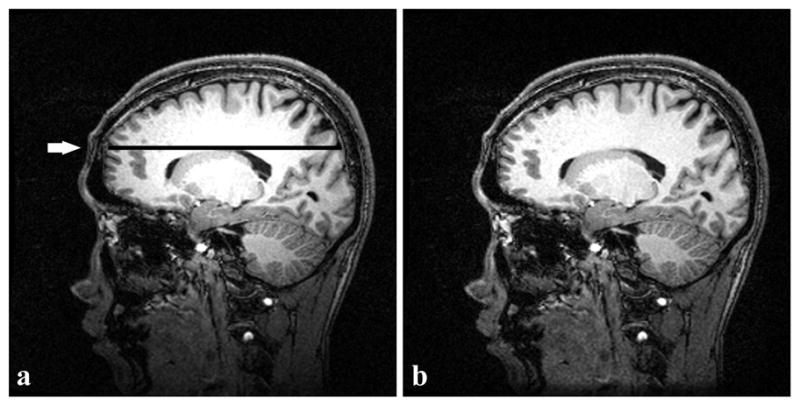
Figure 6.

Single slice of an actual human brain volume (MPRAGE scan, matrix size = 256×256). (a) Original image. (b) Image after inhomogeneity correction with the new algorithm. A sharp intensity drop occurs in the inferior part of (a); after correction, intensity is restored in (b). The intensity profile shown in Fig. 7 corresponds to the dark line (pointed out by the arrow) in (a).
