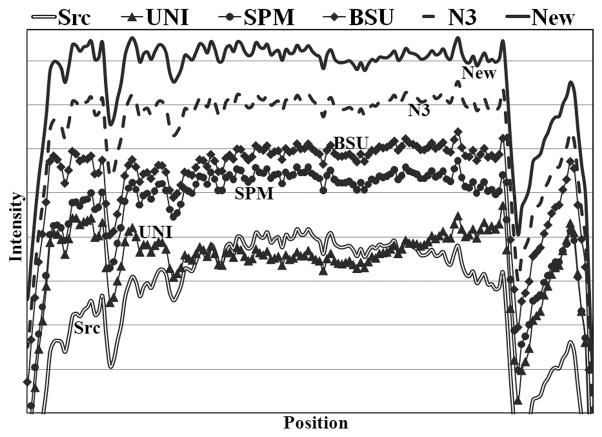
Figure 7.
Line profiles without and with bias corrections using different algorithms. The line passes mainly through the white matter (dark line in Fig. 6a) and therefore the profile is expected to be roughly flat. All the profiles were normalized to the same mean, but were offset by the same amount for clear visualization. The original (Src) image had high intensity in the center, while UNI correction produced high intensity in the peripheries. The other four algorithms produced relatively flat line profiles than the original. N3 and our algorithm yielded the flattest profiles.

