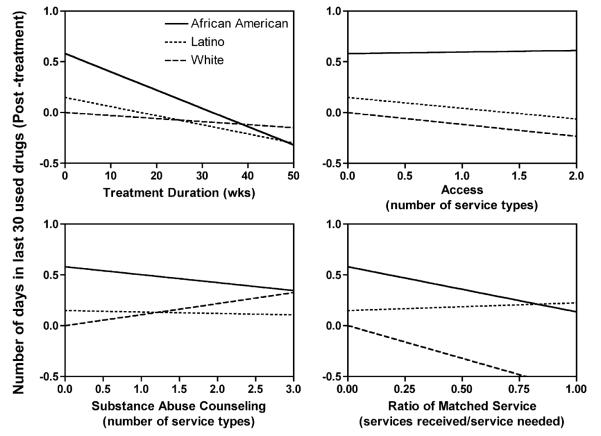
Fig. 1.
Post-treatment drug use (the number of days used the five major drugs in the last 30 days) as a function of treatment duration, access, substance abuse counseling and ratio of matched service for African Americans, Latinos and Whites. The estimated lines for each race/ethnicity group were based on the fitted coefficients of the main effect and interaction in Table 2, assuming all other controlling variables are equal. The main effect of race/ethnicity, 0.18 for Black and −0.233 for Latinos, determined the intercepts, while the main effect of service and the interaction term determined the slope of the lines. For instance, the main effect of ratio of matched service was −0.642, while the interaction term between the ratio of matched service and race/ethnicity was 0.198 (ratio × Black) or 0.718 (ratio × Latinos). The estimated slope of the ratio of matched service was −0.444 (−0.642 + 0.198), 0.076 (−0.642 + 0.718) and −0.642 for African Americans, Latinos and Whites respectively. Note the units in the X and Y axes are real world units, since the treatment duration, access, substance abuse counseling and ratio of matched service were not standardized in the model fitting. For illustration purpose, the post-treatment drug use with zero service was set to be 0 for whites in each panel. The interactions between race/ethnicity and service are all significant except the interaction between Latinos and access.

