
Figure 1.
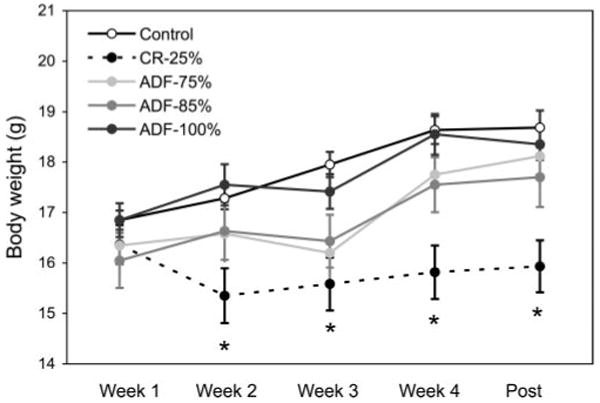
Mean body weight throughout the 4 wk study. Values are means ± SE. Mean body weight in each group was similar during wk 1 of the study. By wk 2, the CR-25% group weighed less than all other groups, and this lower body weight persisted until the last day of the study. There were no differences in body weight between the ADF and control groups throughout the 4 wk study. One-way ANOVA with Tukey's post hoc test was used for all between-group analyses; *P < 0.05.