
Figure 2.
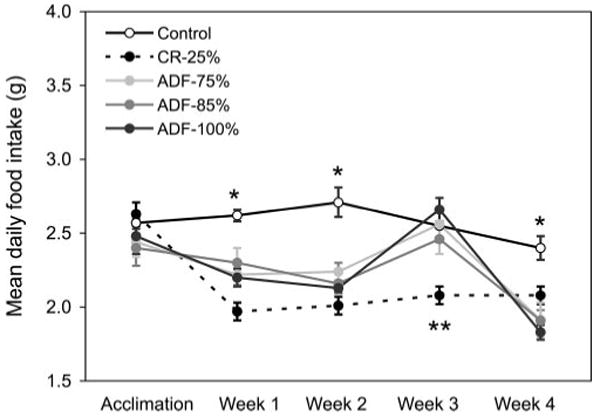
Mean daily food intake throughout the 4 wk study. Values are means ± SE. Each intervention group ate less than control during wk 1, 2, and 4. During wk 3, the CR-25% group ate less than all the other groups. One-way ANOVA with Tukey's post hoc test was used for all between-group analyses; *P < 0.0001, **P < 0.01.