Figure 2.
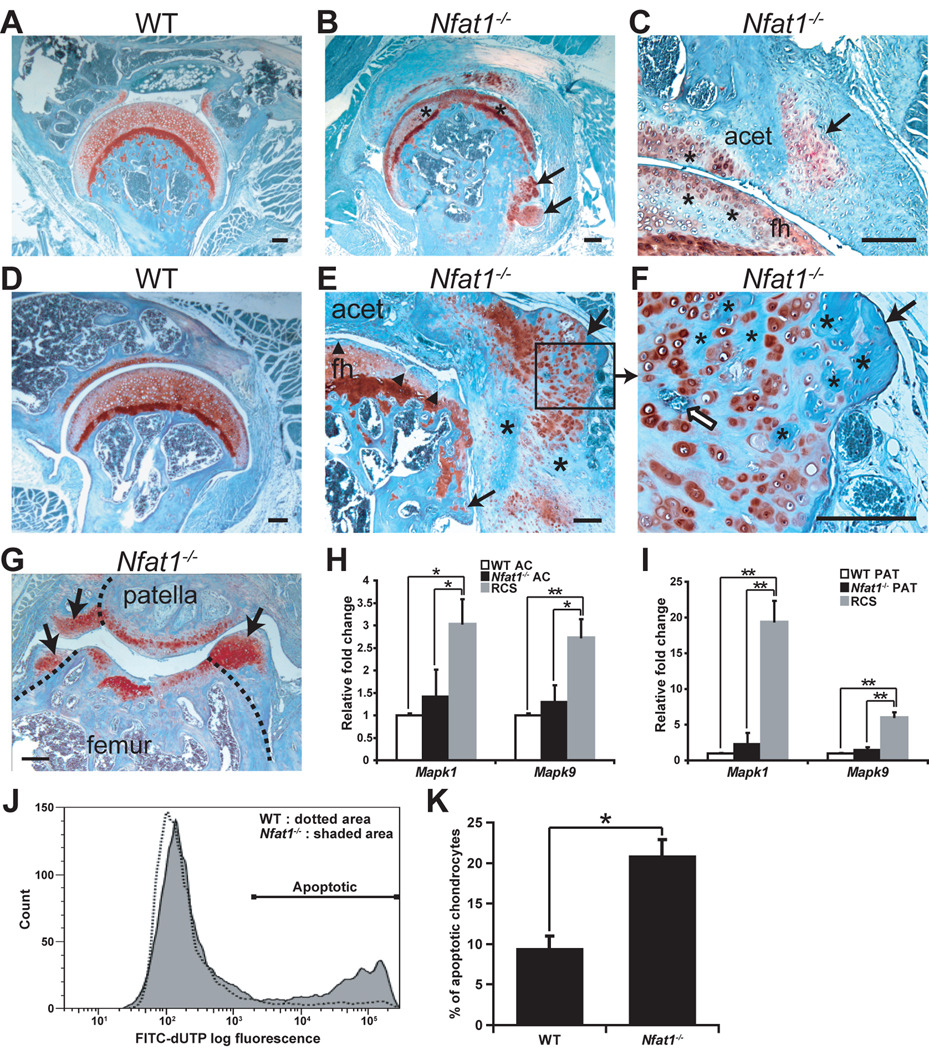
Formation of chondro-osteophytes and apoptosis of articular chondrocytes in Nfat1−/− joints. All photomicrographs are representative of at least 5 Nfat1−/− or WT mice per gender at each time point. Safranin-O and fast green staining and counterstained with hematoxylin. Scale bar = 200 µm. (A) A 3-month-old female WT hip shows normal joint structure and articular surface with diffuse safranin-O staining (red) for proteoglycans throughout the articular cartilage. (B,C) Loss of safranin-O staining (*) with focal chondrocyte proliferation is observed in the upper-mid zones of articular cartilage of both femoral head and acetabulum in 3-month-old female Nfat1−/− mice, which is a feature of early (grade 1) OA [1]. Chondrocyte differentiation and chondrophytes have begun to appear at the junction of articular cartilage and synovium (arrows) of Nfat1−/− hip joints. acet, acetabulum; fh, femoral head. (D) A 12-month-old WT hip shows normal joint structure and articular cartilage. (E,F) A 12-month Nfat1−/− hip shows loss of proteoglycan staining in the upper zone of articular cartilage with surface discontinuity and/or fissuring (▲) and chondro-osteophyte formation (arrows). The process of endochondral ossification is seen in the chondro-osteophytes, including chondrocyte hypertrophy and vascular invasion (open arrow). Cartilage has been partially replaced by newly formed bone (*). Although the development of chondro-osteophytes is exuberant, malignant-looking cartilage or bone cells with large single or multiple hyperchromatic nuclei and large nucleoli are not seen in periarticular chondro-osteophytes. (G) A 9-month Nfat1−/− patellar-femoral joint demonstrates articular cartilage degradation and the formation of chondro-osteophytes appearing as newly formed articular surfaces (arrows). Dotted lines indicate the surfaces of the original articular cartilage/bone. (H,I) qPCR analyses show no significant differences in expression levels of Mapk1 and Mapk9 between Nfat1−/− and WT articular cartilage cells (AC) or periarticular tissue cells (PAT), while their expression was significantly higher in positive control rat chondrosarcoma cells (RCS). According to the 2−ΔΔCT method [23], the expression level of each WT group has been normalized to “one”. n = 3 pooled RNA samples, each prepared from the articular cartilage of 6–8 femoral heads or periarticular tissues of 3–4 joints. * P < 0.05; ** P < 0.01. (J) Flow cytometric analyses demonstrate substantially more apoptotic cells in Nfat1−/− chondrocytes than in WT chondrocytes isolated from 4-month-old femoral head articular cartilage. Overlays of flow cytometric analyses were made using FlowJo software (Tree Star). (K) Quantitative flow cytometric analyses indicate that significantly more apoptotic cells were detected in Nfat1−/− articular chondrocytes than in WT articular chondrocytes. P < 0.05.

