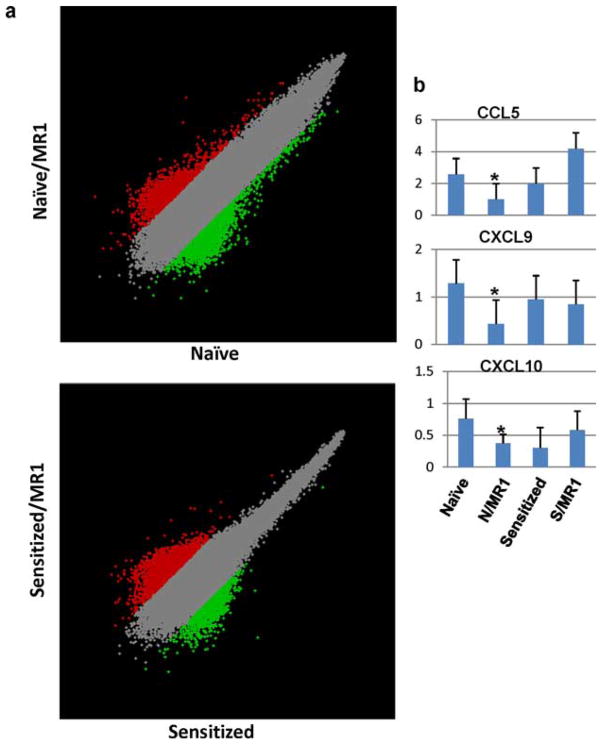
FIGURE 1.
a, Scatter plots of pairwise analysis results. Gene expression data were normalized to samples’ global mean and compared between control Ig and anti-CD154 mAb (MR1)-treated samples from naive (upper panel) vs sensitized (lower panel) recipients. b, Quantitative RT-PCR results of CCL5, CXCL9, and CXCL10 gene expression at the peak of cardiac allograft rejection in naive (day 6) vs sensitized (day 3) recipients. Averages of three individual samples and SD are shown; p < 0.05 when naive vs N/MR1 are compared; p = NS when sensitized vs S/MR1 are compared.

