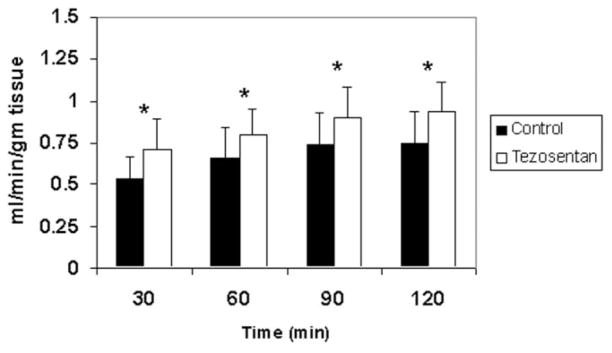
Figure 3.
Portal blood flow is improved after treatment with tezosentan. With the isolated rat liver perfusion apparatus, portal blood flow at 30-minute time intervals was measured during 120 minutes of ex vivo reperfusion. Control results are shown as black bars, and tezosentan results are shown as white bars. Flow on the y axis is expressed as milliliters per minute per gram of liver tissue. Each bar represents the mean ± standard deviation (*P < 0.05; n = 4 per group).

