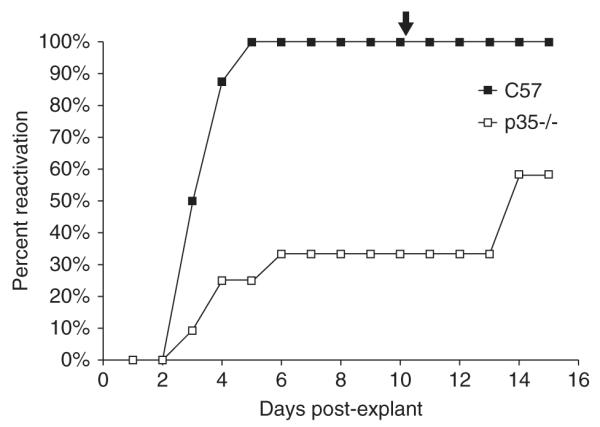
Figure 4.

HSV-1 reactivation in latently infected TG. On days 30 p.i., TG were removed from C57BL/6 and p35-/- latently infected mice and explanted on Vero cells. Medium from each sample was monitored daily for infectious virus over a period of 15 days (n = 8 for C57BL/6, n = 12 for p35-/-). The arrow at the top of the figure (day 10 post explant) indicates that samples were heat shocked at 43°C for 3 h to induce further reactivation. The results from one of two experiments are shown. The percent reactivation is the cumulative amount of reactivation for each set of samples analyzed.
