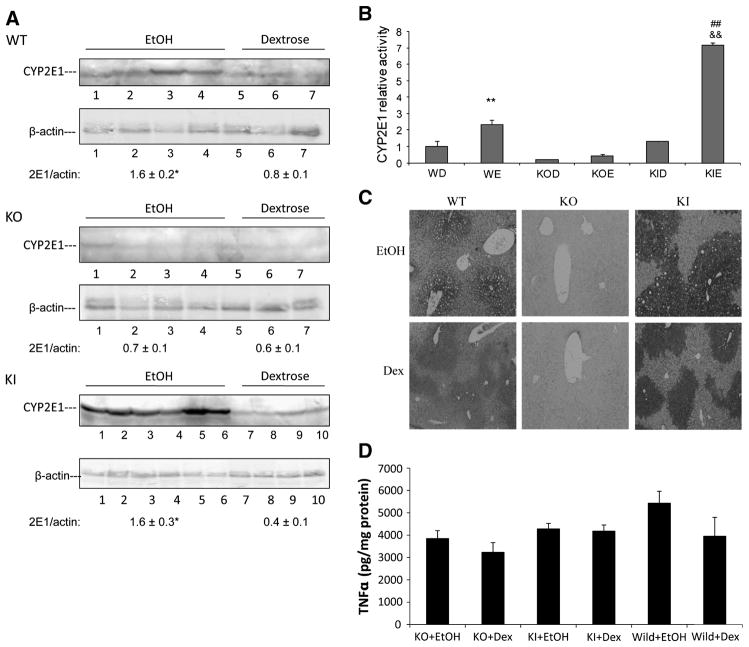
Figure 1. CYP2E1 activities and expression in WT, CYP2E1 knockout and humanized CYP2E1 knockin mice fed dextrose or ethanol diets.
A. Western blotting analysis for CYP2E1 expression. A typical immunoblot is shown and CYP2E1/actin ratios from 3–6 pairs of mice in each group are indicated. * P <0.05 compared with dextrose group.
B. Microsomal PNP activities. ** P<0.01, compared with WT dextrose (WD) group; ## P<0.01, compared with KI dextrose (KID) group; && P<0.01, compared with WT ethanol (WE) group. KOD, CYP2E1 knockout mice fed dextrose diet; KOE, CYP2E1 knockout mice fed ethanol diet; KIE, humanized CYP2E1 knockin mice fed ethanol diet. (n= 3–6 pairs of mice in each group).
C. Immunohistochemistry staining to determine CYP2E1 in the liver.
D. TNFα levels in liver lysates were analyzed by an ELISA method. (n= 3–6 pairs of mice in each group).

