
Figure 3.
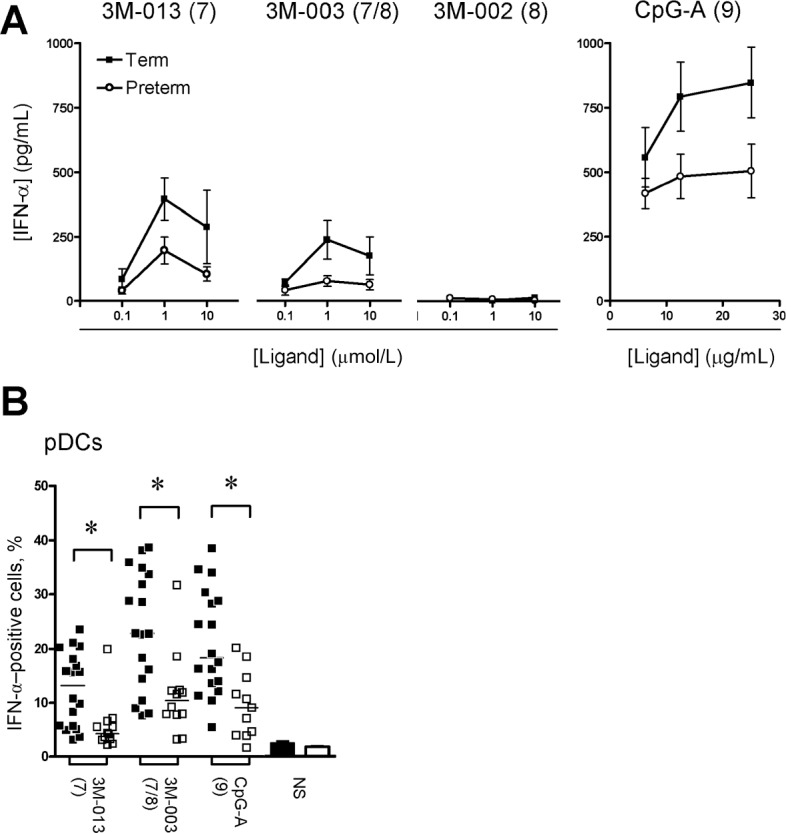
Interferon (IFN)-α cytokine responses. A , Cytokine measured in culture supernatants (mean ± standard error of the mean). B , Peak IFN-α responses (expressed as the percentage of cytokine-producing cells; bars denote the mean) measured in plasmacytoid dendritic cells (pDCs), as determined by flow cytometry. Agonists used for stimulation are shown above each graph, with their respective stimulated Toll-like receptor(s) shown in brackets. * P< .01. NS, unstimulated (bar graphs).