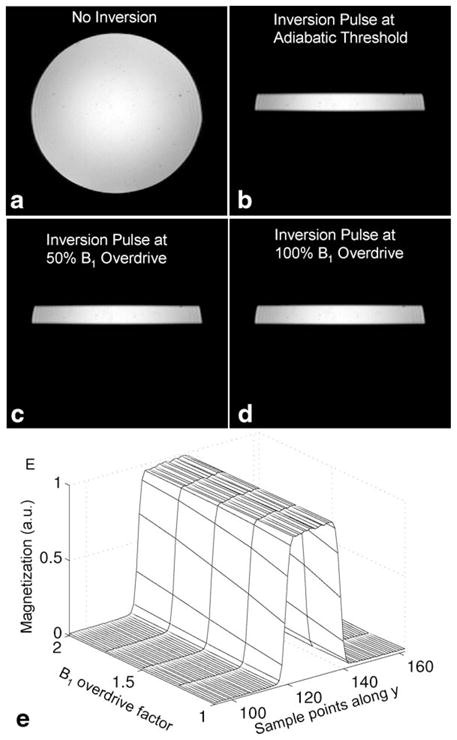
FIG. 8.

Results obtained from a spherical agar phantom at 3 T using the pulse sequence in Fig. 4. (a) Image of a slice through the phantom with adiabatic inversion pulse turned off. Images of same slice with inversion pulse played at (b) the adiabatic threshold, (c) 50% above the adiabatic threshold, and (d) 100% above the adiabatic threshold, subtracted from image in (a). (e) Vertical cross-sections of the phantom images of the inverted band plotted against B1 value of adiabatic SLR inversion pulse. The inverted band is B1-independent.
