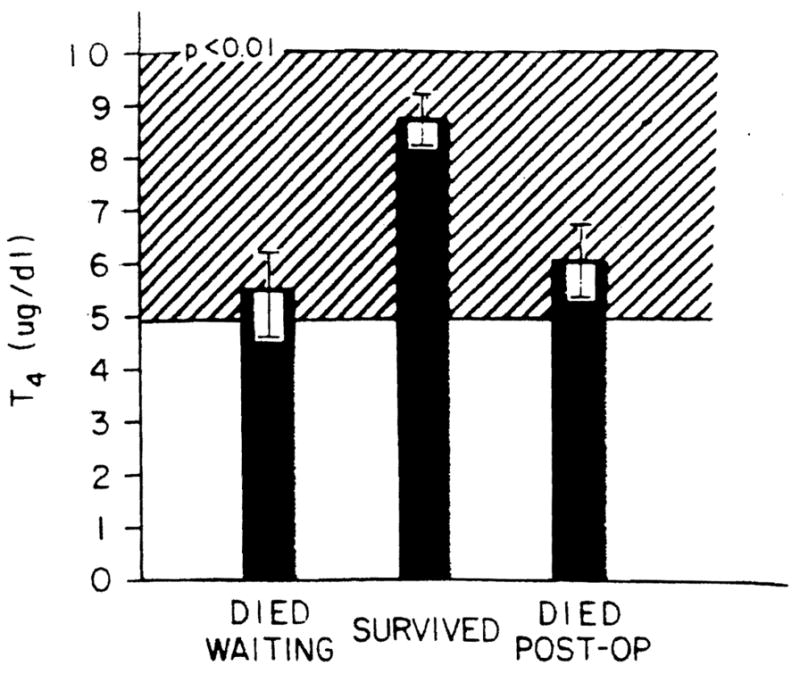
Fig. 1.

T4 levels in the patients studied. The ordinate shows the T4 levels in micrograms per deciliter for the patients studied separated as to outcome. Bars represent mean values, and the brackets represent the S.E. for each group. The cross-hatched area is the normal range.
