
Fig. 4.
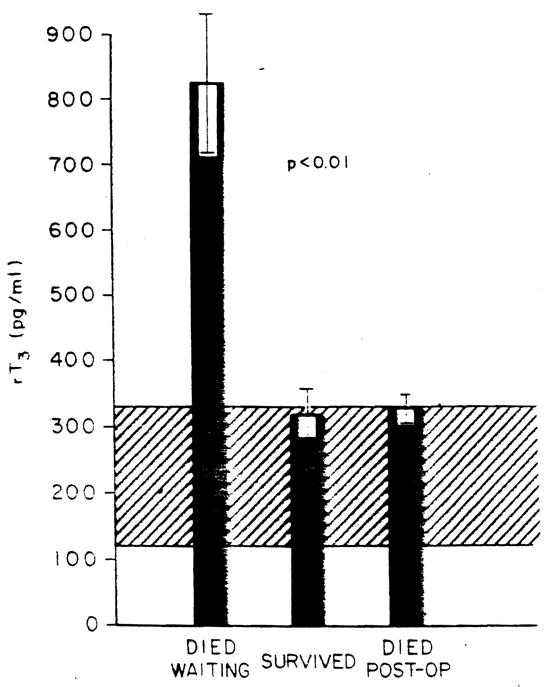
rT3 levels in patients studied. The ordinate shows the rT3 levels in picograms per milliliter. The ordinate shows the data segregated as to clinical outcome. Bars represent mean values: brackets represent S.E.: the cross hatched area is the normal range.