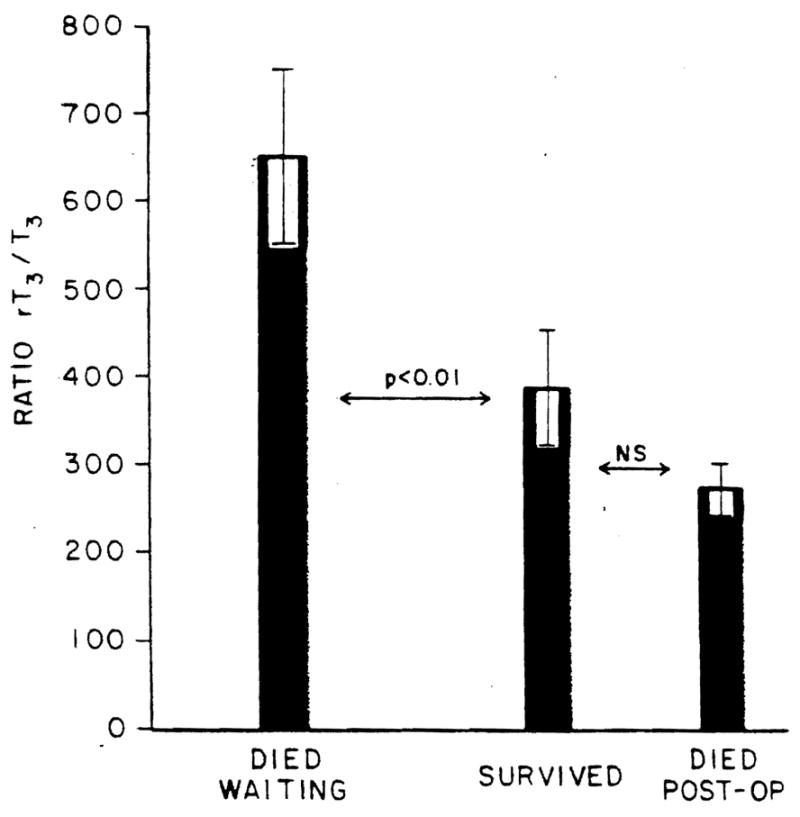
Fig. 5.

Ratio of rT3/T3 in the patients studied. The ordinate shows the ratio in units of picograms × 10−3, Bars represent mean values; brackets represent S.E. NS, not statistically significant.

Ratio of rT3/T3 in the patients studied. The ordinate shows the ratio in units of picograms × 10−3, Bars represent mean values; brackets represent S.E. NS, not statistically significant.