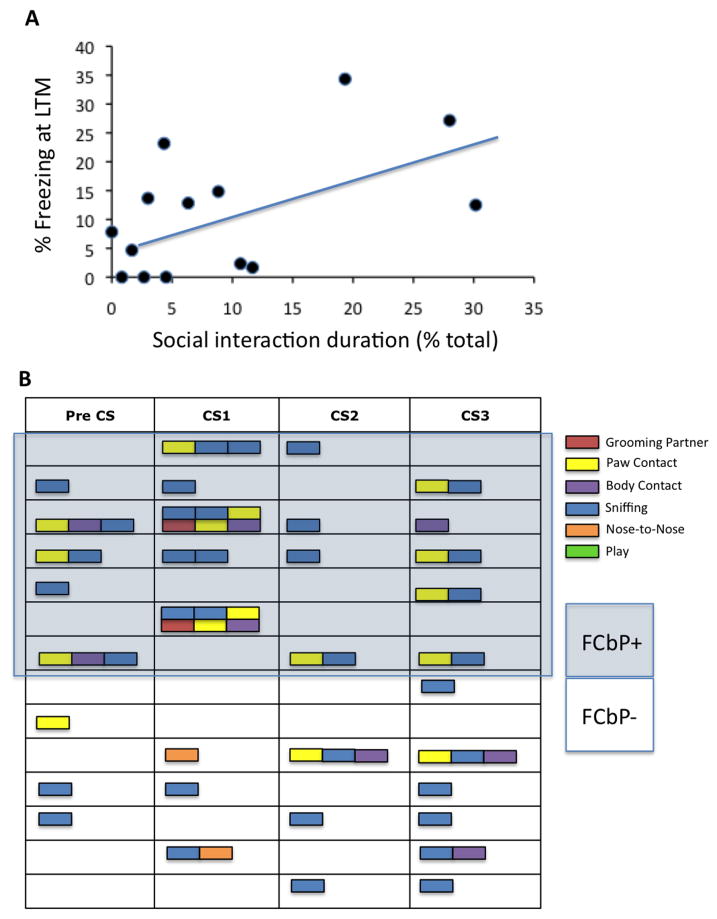
Figure 3.
Social interaction duration and type between the FC and FCbP rats before and during CS exposure. (3A) Relationship between social interaction duration with an FC cagemate during CS, and FCbP freezing the next day. A multiple regression analysis revealed that the duration of social interactions between the FC and FCbP rats significantly accounted for the variance accounted for in FCbP freezing the next day, R(12)=.533, p<.05. (3B) Qualitative depiction of social interaction types between the FC and FCbP rats during each CS, and for 20 seconds prior to the first CS presentation.

