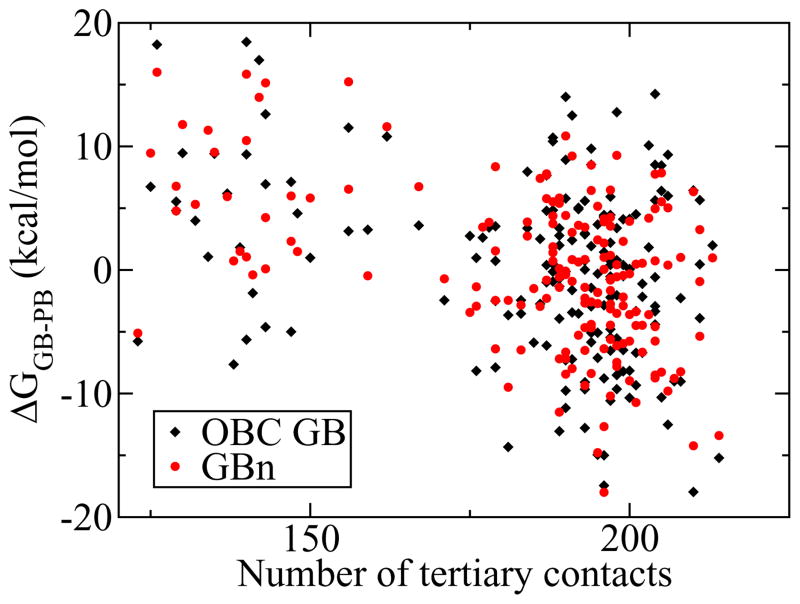
Figure 4.
Relative deviation from PB solvation energy for GBn and OBC GB for a series of snapshots from a denaturation trajectory of protein A. GBn has a tighter clustering of points, indicating less random error than OBC GB (stdev 6.4 vs 7.2 kcal/mol), while maintaining a similar native state bias (trend of points across the plot). Average errors of −9.2 (OBC GB) and 68.9 (GBn) kcal/mol removed to facilitate comparison.

