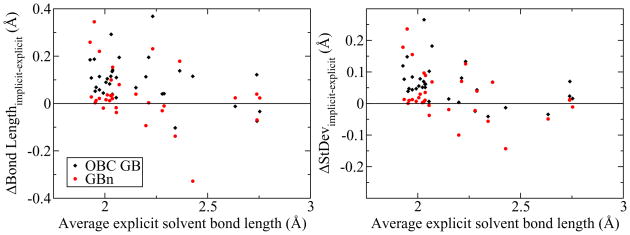
Figure 8.
Ubiquitin backbone hydrogen bond length data collected over 10 ns of MD for TIP3P explicit solvent, OBC GB and GBn. Plots represent difference between implicit and explicit solvent bond length distribution mean (left) and standard deviation (right) as a function of mean explicit solvent bond length. The zero line represents an exact match between the explicit and implicit solvent results. Hydrogen bond lengths under the GBn model are generally in better agreement with explicit solvent results.

