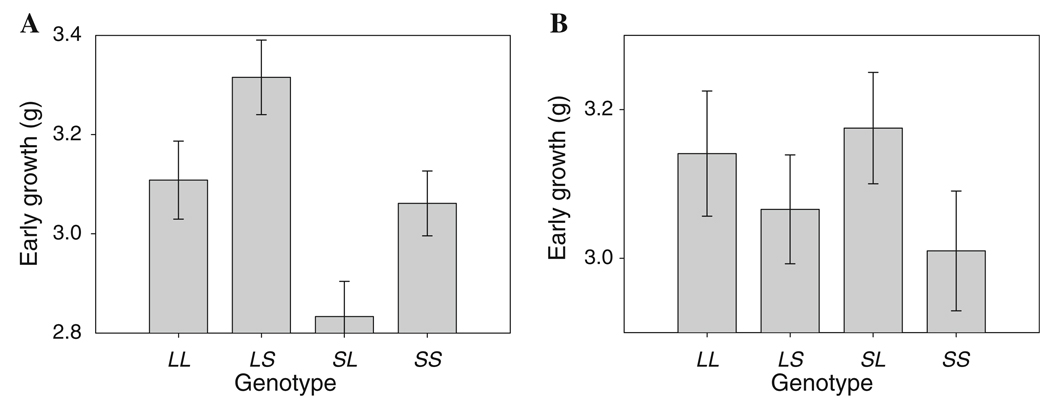
Fig. 4.
An example of the change in the pattern of effect of epiEG6.1 across genetic backgrounds at epiEG3.1. In all cases, genotypes at both loci are labeled LL, LS, SL, and SS, as in Fig. 3. Bars correspond to the genotypic values (i.e., mean phenotypes) derived from the mixed model for early weight of each genotype, with error bars being standard errors of these means. a The pattern of expression at epiEG6.1 on the LS background at epiEG3.1, which is consistent with bipolar dominance. b The pattern of expression of epiEG6.1 on the SL background at epiEG3.1, which is consistent with weak maternal expression

