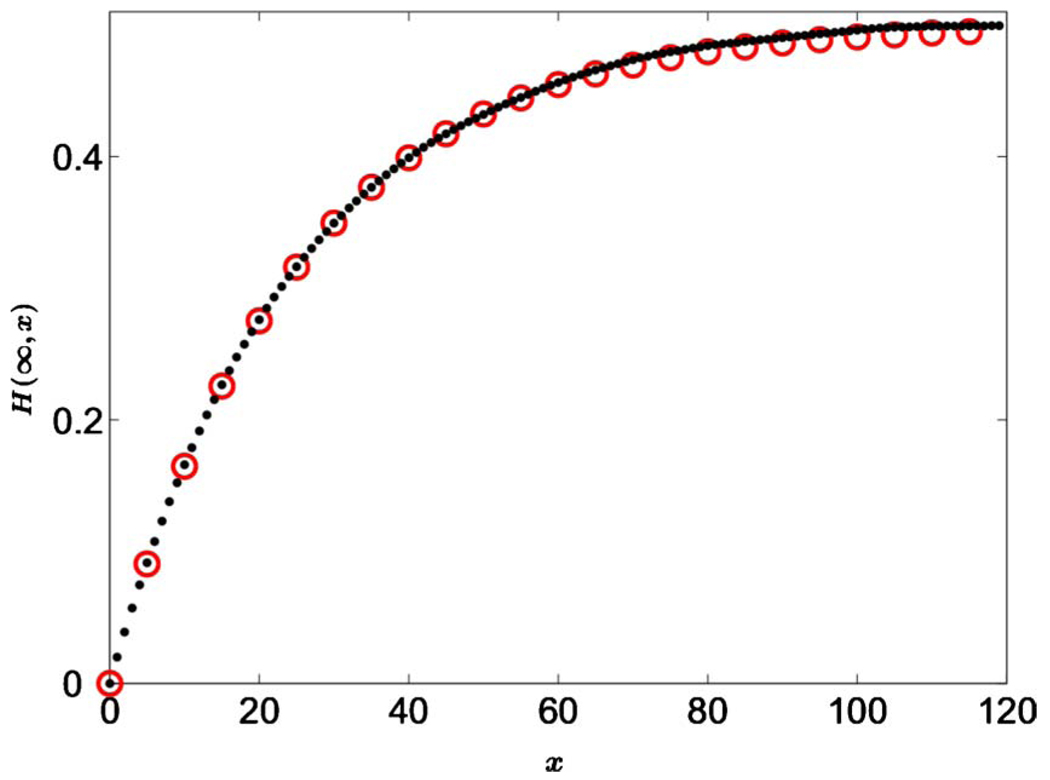
FIG. 12.
(Color online) Equilibrium between mutation and genetic drift in the absence of selection. Comparison between the analytical prediction for the steady-state heterozygosity H(∞,x) and the simulations with μ̃12=μ̃21=10−4. The black dots represent the results of the simulation and the circles represent the best fit of theoretical result given by Eq. (48) to the data. Here only Dg is a fitting parameter; the values of Ds, μ12, and μ21 follow from the correspondence between the discrete and continuum models. The data are obtained in a simulation of 3200 individuals for 2×10⁵ generations with averaging over 100 realizations. At t=0, each site is assigned either allele one or allele two with equal probability.

